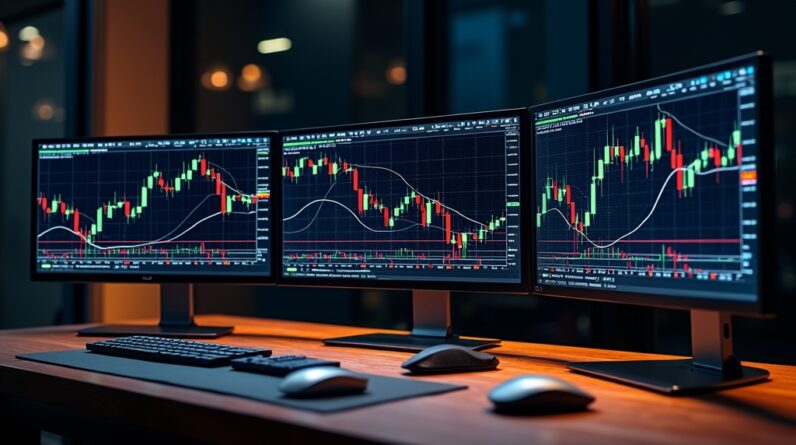
Forex technical analysis is your secret weapon! It helps you understand market movements using historical data. Here’s what you need to know:
- Analyze Trends: Spot rising or falling prices.
- Support & Resistance: Key levels where prices bounce.
- Indicators: Use moving averages and candlestick patterns for trading signals.
Mastering these tools means better trades and bigger profits! Ready to surge ahead? There’s much more exciting stuff to discover! 🚀
In the thrilling world of Forex trading, technical analysis is your trusty compass! 🌟 It helps you navigate the unpredictable waters of currency pairs. By analyzing historical data, trends, and patterns, you can predict future price movements. Isn’t that exciting?
Traders focus on price charts and market stats to find the best entry and exit points. Common tools in your trading toolkit include moving averages, volume, and momentum indicators. These tools help you spot trends and make informed decisions. To develop effective strategies, you’ll want to combine pattern recognition with indicator analysis. This way, you can better predict where the market is headed. Recognizing key candlestick patterns, such as the Doji and Hammer, can further enhance your trading decisions.
One popular strategy is the breakout strategy. This involves trading when the price breaks through key support or resistance levels. To identify breakouts, look for higher-than-average trading volume accompanying the price move. When entering a trade, go in the direction of the breakout. Remember, always set stop-losses just beyond the breakout point and target profits based on expected market moves.
Another strategy is the reversal strategy. This one aims to profit from market direction changes. You’ll want to identify patterns and use indicators like RSI or MACD. These can signal overbought or oversold conditions. Enter trades opposite to the current trend, but don’t forget to set stop-losses beyond the reversal point!
Support and resistance levels are essential, too. These are areas where prices bounce or stall. The more a price bounces off a support level, the stronger it becomes. Analyzing past price movements helps you identify these key zones, as support and resistance levels prevent price from falling or rising further. Additionally, marking historical price patterns can help you identify potential future price movements.
Lastly, trend analysis is fundamental. Determine if the market is trending up, down, or sideways. Use higher timeframes for better clarity. Following the trend can maximize profits, but always watch for signs of reversal!
Frequently Asked Questions
What Is the Best Time Frame for Beginners in Forex Trading?
Choosing the right time frame is essential for beginners! Here’s a quick guide to help you out:
- Scalping: 1-15 minute charts for lightning-fast trades!
- Day Trading: 15 minutes to 4 hours for intraday action!
- Swing Trading: 4-hour to daily charts for holding trades a few days!
- Position Trading: Daily, weekly, or monthly for long-term gains!
Pick a time frame that suits your style, and you’ll be on your way to trading success! 🚀
How Do I Choose Which Currency Pairs to Analyze?
Choosing currency pairs to analyze can be thrilling! Here’s how to plunge into it:
- Start with Major Pairs: Think EUR/USD or USD/JPY! They’re like the rock stars of forex—high liquidity and low spreads! 🎉
- Consider Your Goals: Are you day trading or long-term investing?
- Use Analytical Tools: Charts and news can be your best friends! 📈
Remember, practice with a demo account and adjust based on your findings!
Happy trading! 🚀
Can Technical Analysis Alone Guarantee Successful Trades?
- Market Mysteries: Prices are influenced by news and events, not just charts.
- The Odds: About 90% of retail traders lose money over time!
- Mix It Up: Successful traders combine tools—like risk management and psychology.
Remember, relying solely on technical analysis is like fishing with a net full of holes! 🎣
Use a variety of strategies for the best catch!
What Tools Are Essential for Forex Technical Analysis?
To excel in technical analysis, you need essential tools! Here’s your starter kit:
- Trading Platforms: Use MetaTrader 4 (MT4) or 5 (MT5) for real-time quotes and advanced charts!
- Technical Indicators: Rely on Moving Averages, RSI, and MACD to spot trends and signals!
- Screeners & Filters: These help you find the best trading opportunities quickly!
- Advanced Tools: Don’t forget drawing tools and smart alerts for timely decisions!
Get ready to trade! 🚀
How Often Should I Update My Technical Analysis?
Updating your analysis is essential! 📈 Here’s how to do it:
- Scalpers: Update every few minutes! ⏱
- Day Traders: Check several times daily! 🔄
- Swing Traders: Daily or weekly updates work! 📅
Stay in tune with market vibes! Use higher time frames to spot trends and lower ones for precise moves. 🎯
Keep it lively and avoid getting lost in the noise! 🚀


